CUSTOMER SUCCESS SCORECARD · SALESFORCE
Turning customer health data into confident business decisions.
I developed a multi-method research strategy and partnered with a team of researchers to shape the next generation of Salesforce’s Customer Success Scorecard; connecting customer evidence to product adoption, retention, and critical product decisions.
ROLE — Research Strategy Lead & UX Researcher
SCOPE — Enterprise UX · Customer Success · AI
RESEARCH — Interviews · Surveys · Heuristic Evaluation · Usability Testing · A/B Testing
Some product visuals and details have been simplified or adapted to protect confidential information.

THE CHALLENGE
A health score isn’t useful if customers don’t know what to do with it.
Salesforce created the Customer Success Scorecard to help customers understand the health of their implementation and identify opportunities to increase adoption and value. But the experience could tell customers that something had changed without consistently explaining why it changed, what mattered most, or what they should do next. Following an accelerated initial release with significant executive visibility, the next iteration needed to evolve from a reporting experience into a more credible and actionable decision-support tool.
ADOPTION
Help customers identify opportunities to use more Salesforce capabilities.
RETENTION
Make customer-health information useful enough to support long-term customer success.
ACTIONABILITY
Help customers understand what requires attention and what to do next.
MY ROLE
My responsibility extended beyond conducting the studies.
I identified the critical questions the organization needed to answer and developed a multi-method research strategy to address them. I coordinated research activities across a team of researchers, drafted interview guides, surveys, and usability studies, oversaw the heuristic evaluation, contributed directly to research execution, and helped lead synthesis across the program. I translated evidence across methods into prioritized recommendations for Product, Design, Engineering, Sales, and Strategy—connecting individual usability findings to broader questions about adoption, retention, customer value, and product direction.
DEFINE
Identify critical questions
PLAN
Build research strategy
COORDINATE
Align research activities
SYNTHESIZE
Connect evidence
INFLUENCE
Drive product decisions
WHAT WE NEEDED TO LEARN
Before choosing methods, I defined the questions that mattered.
01 — UNDERSTANDING
How do customers interpret the Scorecard and understand what is affecting their customer health?
02 — ACTION
Does the experience give customers enough context to determine what they should do next?
03 — DISCOVERABILITY
Can customers find and understand new capabilities, recommendations, alerts, and beta features?
04 — BUSINESS VALUE
Can the experience connect Salesforce product usage to the business outcomes customers actually care about?
RESEARCH STRATEGY
A coordinated research strategy.
No single method could answer the range of questions facing the product. I structured the research program so that each method reduced a different type of uncertainty, while findings could be synthesized across the broader experience.
Throughout the program, I partnered biweekly with Product Managers, Engineers, Sales Executives, Researchers, and Strategists to align evolving questions, communicate emerging evidence, and connect findings to product and business priorities.
DISCOVER
Interviews + Journey Mapping
Understand workflows, expectations, and trust
EVALUATE
Heuristic Evaluation
Identify systemic usability risks
VALIDATE
Usability + A/B Testing
Evaluate emerging product directions
SYNTHESIZE
Cross-study Analysis
Connect evidence across methods
PRIORITIZE
Recommendations
Translate evidence into product direction
DISCOVERY
The Scorecard supported different decisions across the customer lifecycle.
Discovery research showed that the Scorecard wasn’t serving a single workflow. Customer Success, Renewal, and Sales teams approached customer-health information with different responsibilities and different decisions to make.
CUSTOMER SUCCESS MANAGER
Monitor customer health
Investigate technical issues
Build customer success narratives
Add qualitative context to the data
RENEWAL MANAGER
Forecast attrition risk
Audit account footprint
Model renewal scenarios
Identify early warning signals
ACCOUNT EXECUTIVE
Identify expansion opportunities
Build commercial strategy
Track customer sentiment
Identify unused capabilities
THE IMPLICATION
The Scorecard couldn’t simply report customer health. It needed to support different decisions across customer success, renewal, and expansion workflows.
A FOUNDATIONAL INSIGHT
“The biggest pain point is severe data distrust. I manually verify data outside of CSS before every client meeting because a ‘0’ could just be a tracking error.”
Senior Customer Success Manager · Discovery Participant
TRUST WAS THE FOUNDATIONAL PROBLEM
When users couldn’t confidently explain where a score came from, they created manual workarounds and verified information outside the Scorecard. This limited the product’s ability to function as a credible customer-facing decision tool.
RESEARCH EVIDENCE — USAGE PATTERNS

EVALUATION · HEURISTIC ANALYSIS
Complex terminology made an already complex system harder to trust.
The heuristic evaluation reinforced patterns emerging from discovery research. Important signals were often presented using specialized terminology without enough contextual explanation, making it difficult for users to confidently interpret what the data meant.

WHAT WE OBSERVED
Signal names within the dashboard were often complex and lacked immediate contextual definitions. Users could not always determine what a metric represented or why it mattered without seeking information elsewhere.
RECOMMENDATION
Introduce contextual definitions or lightweight explanations for complex signals and use familiar, plain-language terminology where possible.
WHY IT MATTERED
The Scorecard was intended to help customers understand their Salesforce health. Requiring users to leave the experience to interpret its metrics increased cognitive load and made it harder for the product to function as a trusted decision-support tool.
FROM USABILITY ISSUE TO PRODUCT QUESTION
The problem wasn’t simply whether users understood individual labels. It raised a broader question: when should Salesforce-specific terminology be preserved, and when would familiar customer language create a clearer experience?
This finding contributed to broader cross-functional conversations about branded terminology versus common language across the experience.
VALIDATION · A/B TESTING
Research turned three competing design directions into a clear product decision.
Additional Feature Recommendations were intended to help customers discover Salesforce capabilities that could improve adoption and business outcomes. The team had three competing approaches for presenting those recommendations, and we needed evidence about which experience made the next step clearest and most actionable.
THE QUESTION
How should additional feature recommendations be surfaced without overwhelming the customer or disconnecting them from the context of the Scorecard?

A — SIDE PANEL
Preserved visibility of the underlying Scorecard while presenting recommendations alongside the existing experience.
Internal participants found the recommendation experience contextually disconnected despite preserving the underlying dashboard.
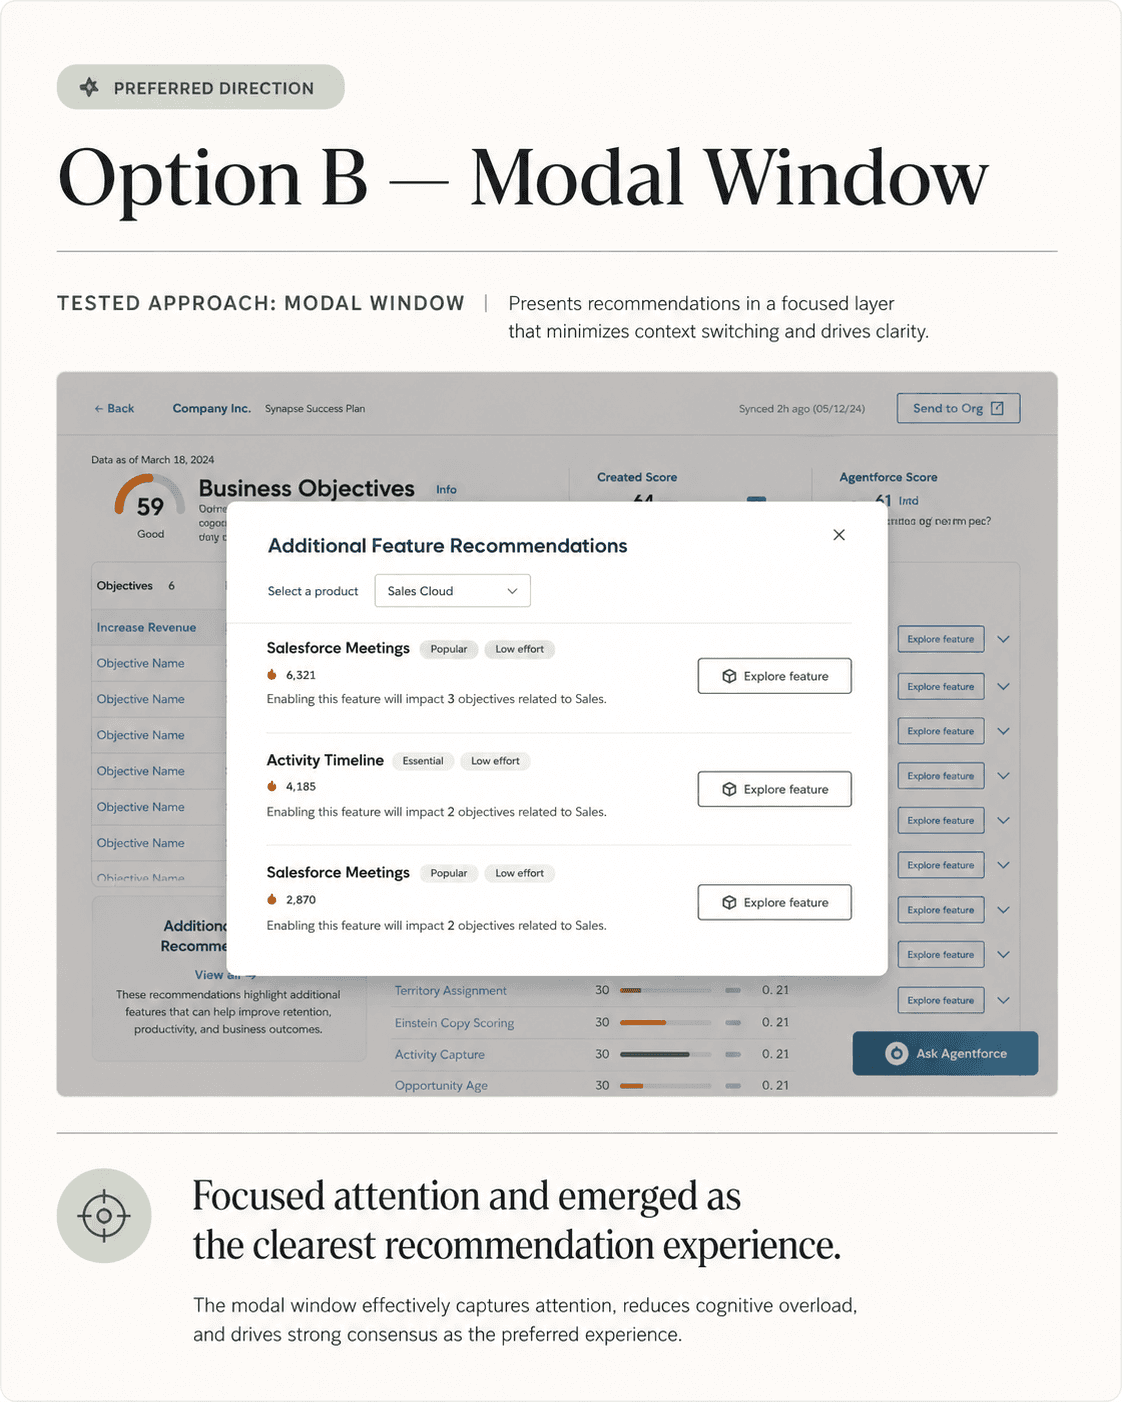
B — MODAL WINDOW
PREFERRED DIRECTION
Centered recommendations in a focused experience while temporarily reducing competing interface information.
Participants valued the modal’s prominent placement and ability to focus attention on recommended actions.

C — EMBEDDED LIST
Placed recommendation content directly within the existing Scorecard interface.
The embedded approach introduced additional information into an already dense interface and increased concerns about cognitive load and clutter.
DECISION
Move forward with the modal approach for Additional Feature Recommendations.
The centralized modal created a clearer moment of focus for recommendations and made the next action easier to understand without permanently adding more information to an already complex dashboard.
WHY IT MATTERED
This study reduced uncertainty around how recommendations should enter the customer workflow and gave the team evidence to move forward with a specific interaction direction.
RESEARCH OUTCOMES
What changed because of the research
The research informed five product decisions across value, cadence, recommendations, information architecture, and AI interaction.
01
Reframe customer health around business objectives
WHAT WE LEARNED
Customers understood the Scorecard’s value more clearly when Salesforce capabilities connected to business outcomes.
WHAT CHANGED
The experience was reoriented around customer business objectives instead of reporting product activity alone.
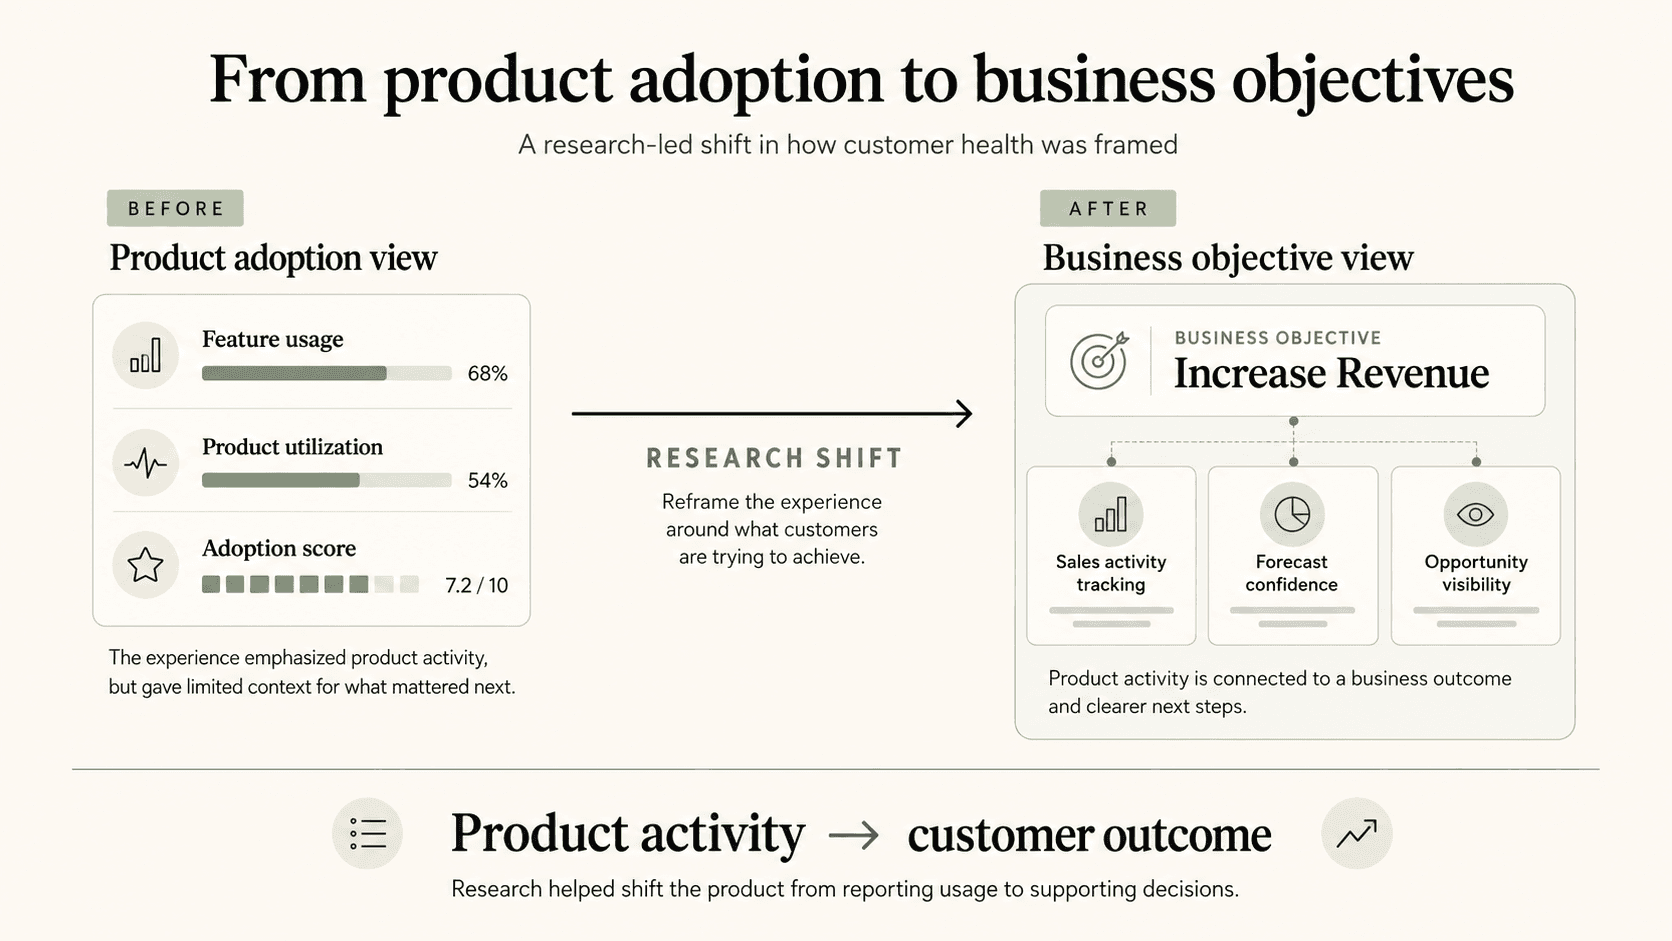
Business objectives became the frame for interpreting customer health.
02
Move from monthly snapshots to more timely signals
WHAT WE LEARNED
Users valued more current indicators while research also surfaced the risk of overreacting to short-term fluctuations.
WHAT CHANGED
Recommendation: move toward weekly change tracking while preserving longer-term historical context.
03
Make recommendations a clearer moment of focus
WHAT WE LEARNED
Comparative testing showed the strongest internal preference for the centralized modal experience.
WHAT CHANGED
Recommendation: move forward with the modal direction for Additional Feature Recommendations.
04
Connect features to business outcomes
WHAT WE LEARNED
Users struggled to understand how individual Salesforce capabilities related to broader customer objectives.
WHAT CHANGED
The product direction made the relationship explicit: Product → Feature → Business Objective.
05
Centralize conversational AI in Ask Agentforce
WHAT WE LEARNED
Repeated Explore Feature actions created visual clutter and mismatched expectations about AI interaction.
WHAT CHANGED
The product direction centralized conversational AI within a dedicated Ask Agentforce experience.